Mitigating reduced flood peaks, magnitudes, and frequency
Contents
Introduction
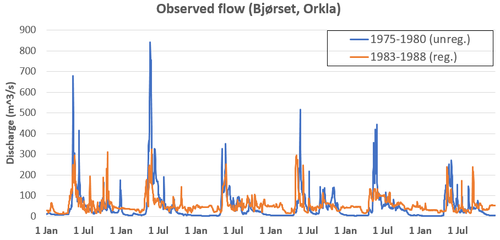
Reservoir-based hydropower will normally lead to a dramatic reduction in floods, unless the flood occurs when the reservoir is more or less filled, or the reservoir is small compared to the inflow. Some reservoirs are built for this purpose, i.e. flood protection. The ecological function of floods to the river system will then also disappear. The reduced frequency of flooding events may result in a deterioration of habitat quality, both by the silting of spawning habitats and the clogging of sheltered habitats. Floods act as 'habitat fresheners' as they remobilise the river bed material, if the floods are sufficiently large and flush out finer sediment fractions. In later sections of this document, habitat measures to refresh the substrate have been described, which will reinstate the natural substrate conditions and improve the habitat. Reinstating floods is one way of refreshing the substrate with use of the flow. Floods can also have other ecological functions, for instance to facilitate migration and to attract fish for spawning. These floods (freshets) are typically smaller than the natural, annual flood, but the river regulation can also reduce these floods. Such freshets are usually named attraction flow to initiate upstream migration and trigger flow to initiate downstream migration. These floods can also be reinstated, and similar to floods to remobilise the substrate, the magnitude, timing and frequency of these should be when the ecological function is maximised, and the losses in power production minimised.
Methods, tools, and devices
During planning
A hydrologic analysis of flood events before and after regulation will also provide data to support the likelihood that reductions in flood frequencies have reduced, or may in the future reduce, long-term production by causing habitat deterioration. To what extent the habitat has been degraded, can be assessed by habitat mapping (Forseth and Harby 2014).
Some studies make a distinction between armoured and paved layers, related to the resistance of surface layers to floods, e.g. less than 10 years for armour, more than 100 years for pavement. The break-up of the armour layer has been observed for floods with a recurrence interval of at least 7 to 10 years. When the break-up of the armour layer occurs, there is a significant increase in the bedload discharge.
During implementation
If properly designed gates and valves are in place, the introduction of a new flow regime would simply be to release the defined water flows at the right time of the day and year. If the existing infrastructure cannot release the proposed flow regime, retrofitting of the dam or any other location the water should be released from, must be carried out.
During operation
Hydropower operators must normally document that environmental restrictions are followed, and they would have standard monitoring systems (gauging stations) in place. The improvements in the substrate composition and habitat conditions can be measured by for instance measuring the interstitial space.
Shelter for juvenile salmonids can be measured with a simple method where the number and depth of interstitial species within a given area is counted with use of a rubber tube (Finstad et al. 2009). The number of spaces of varying length are weighed according to their depth and then summed. The number of interstitial spaces within an area of 50 cm * 50 cm, limited by e.g. a steel-frame (Figure 4-5), is counted and the depth registered. The sizes of interstitial spaces are determined based on how far down between the rocks the hose can be inserted.
The effect of the released environmental flow must be done by assessing the development of the fish population, e.g. by monitoring juvenile fish densities, number of smolts, etc.
