Hydropeaking indicator
Contents
Quick summary
Developed by: French Agency For Biodiversity, Ecohydraulic Team AFB-IMFT, Courret D, Larinier M and Baran P.
Date: 2014
Type: Tool
Suitable for the following measures:
| Classification | Selection |
|---|---|
| Fish species for the measure | All |
| Does the measure require loss of power production | Operational (requires flow release outside turbine) |
| Operational (requires flow release through turbine) | |
| - | |
| Recurrence of maintenance | Never |
| Which life-stage of fish is measure aimed at | Spawning / Recruitment |
| Juveniles | |
| Adult fish | |
| Movements of migration of fish | |
| Which physical parameter is mitigated | - |
| - | |
| - | |
| - | |
| - | |
| - | |
| - | |
| Water velocity | |
| Water depth | |
| Hydropower type the measure is suitable for | Plant in dam |
| Plant with bypass section | |
| Dam height (m) the measure is suitable for | All |
| Section in the regulated system measure is designed for | - |
| - | |
| Bypass section | |
| Downstream outlet | |
| River type implemented | Steep gradient (up to 0.4 %) |
| Fairly steep with rocks, boulders (from 0.4 to 0.05 %) | |
| Slow flowing, lowland, sandy (less than 0.05 %) | |
| Level of certainty in effect | Very certain |
| Technology readiness level | TRL 9: actual system proven in operational environment |
Introduction
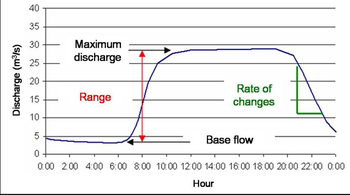
Hydropeaking at hydroelectric facilities (more than 150 in France) generates sudden changes in flow in the river and can affect the composition, the abundance and the structure of fish and invertebrates populations over long distances. The objectives of the “Hydropeaking indicator” tool are (1) to characterize peaks within hydrograph and (2) to produce a synthetic indicator of hydrological disturbance, related to the impacts on fish populations.
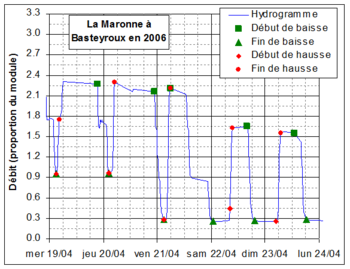
From the analysis of 97 stations and 1575 years of flow data, rates of change of natural flow variations have been first characterized (Figure 1 and 2) within 8 ranges between 5% and 4 times the mean inter-annual discharge. Formulas representing the "fastest variations possible naturally" and taking into account the type of change (increase or decrease), the size of the stream (via the mean inter-annual discharge) and the flow range over which the variation takes place have been constructed and then used to discriminate hydropeaks and natural events.
From the analysis of 80 stations and 491 years of flow data affected by hydropeaking, a method was developed to identify, within the hydrograph, hydropeaks whose characteristics are beyond what can occur in natural hydrology, using 3 criteria: a minimum range (≥ 10% of the mean inter-annual discharge and ≥ 20% of the hydropeak base flow), a minimal rate of change (> to the maximum natural rate of change) and an upper limit on the maximum flow rate (to remove flood events).
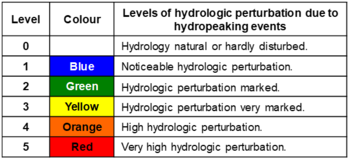
A synthetic indicator differentiating 5 levels of hydrological disturbance induced by hydropeaking regimes was constructed (Figure 3). The level of disturbance of each of the 491 years of flow data was evaluated by 3 expert operators according to the knowledge of the biological impacts of hydropeaking. The linear discriminant analysis allows reproducing this classification using 5 characteristic parameters of hydropeaking regimes (87% of correct reclassification).
Application
The hydropeaking Indicator needs discharge time series as input file, with a fixed or variable time step. This time step should be short to precisely describe the hydropeaks (< 0.5-1 h). The indicator can be produced per year or per period corresponding to biological phases / seasons. Its automated calculation requires knowing only the mean inter-annual flow of the river and the maximum turbine discharge of the hydropower plant upstream.
The hydropeaking Indicator produces (1) a set of parameters that characterizes each hydropeak (base flow, maximum flow, rate of change…) and their statistics, and (2) the score provided by the discriminant analysis and the level of perturbation.
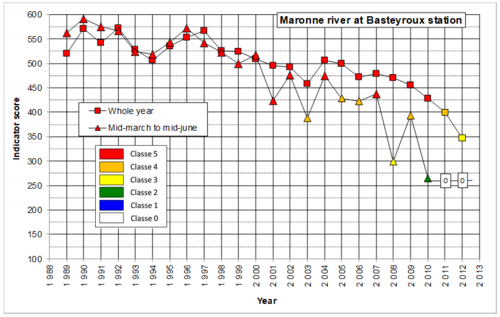
Examples show that the indicator is sensitive to changes in hydropower plant management and allows appreciating the spatial and temporal changes in hydropeaking regimes, including the damping in the downstream direction (Figure 4). This indicator is a tool for managers of "pre-diagnosis" of biological impacts and for monitoring spatial and temporal changes in hydropeaking.
Other information
The Hydropeaking Indicator is implemented in an Excel sheet, using a macro coded in Visual Basic. The tool can be transmitted for free by the Ecohydraulic Team AFB-IMFT after agreement.
At the French Test Cases an electromagnetic flow meter Marsh McBirney, FLO-MATE 2000 is used.
Relevant literature
- Courret D, 2010. Etude des gradients des variations de débit naturelles en vue de la fixation des critères pour le repérage des éclusées hydroélectriques. Rapport GHAAPPE RA.09.04.
- http://oai.eau-adour-garonne.fr/oai-documents/59478/GED_00000000.pdf
- Courret D, Larinier M, Baran P, 2014. Développement d’une méthodologie de caractérisation des éclusées hydroélectriques et Définition d’un indicateur du niveau de la perturbation hydrologique *induite (seconde version). Rapport GHAAPPE RA.14.02.
- Courret D., 2014. Caractérisation de la perturbation hydrologique induite par les régimes d'éclusées hydroélectriques et définition d'un indicateur - Réflexion sur les mesures de mitigation des impacts des éclusées sur les populations de poissons. Thèse de l'INP Toulouse.
- http://ethesis.inp-toulouse.fr/archive/00002880/


