Difference between revisions of "Structure from motion (SfM)"
Bendikhansen (talk | contribs) |
Bendikhansen (talk | contribs) |
||
| Line 1: | Line 1: | ||
=Quick summary= | =Quick summary= | ||
| − | |||
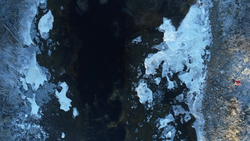
[[file:sfm_drone_picture.png|thumb|250px|Figure 1: Drone picture taken in a height of 50 m over ground showing the residual flow area in Anundsjø HPP, ice cover and the drone controller.]] | [[file:sfm_drone_picture.png|thumb|250px|Figure 1: Drone picture taken in a height of 50 m over ground showing the residual flow area in Anundsjø HPP, ice cover and the drone controller.]] | ||
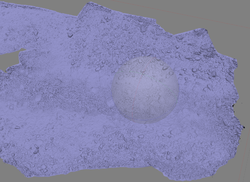
[[file:sfm_evaluation.png|thumb|250px|Figure 2: First run of a structure from motion evaluation in the lab of NTNU. The blue field indicates the camera position.]] | [[file:sfm_evaluation.png|thumb|250px|Figure 2: First run of a structure from motion evaluation in the lab of NTNU. The blue field indicates the camera position.]] | ||
Revision as of 13:02, 20 January 2020
Contents
Quick summary
Developed by: Various Companies
Date:
Introduction
The technique of structure from motion was developed for the video-game industry to allow fast and easy 3D detection and evaluation of bodies. With this technique, it is possible, based on pictures of an object taken with a camera to combine these pictures and based on a software evaluation There are several approaches to generate a 3D model from SfM. In incremental SFM (Schönberger & Frahm 2016), camera poses are solved and added one by one. In global SFM (Govindu 2001), the poses of all cameras are solved for at the same time.
The best result can be achieved when taking pictures from every angle around the object. However, this is not possible for rivers, depending on the river bank vegetation only a flight directly above but with no relevant angle to the sides is possible (Figure 1).
The same problem might appear when using the technique in the lab (Figure 2).
For a sufficient accuracy of the results, at least a camera with a high quality GPS sensor needs to be used. The use of targets or even coded targets would be more favourable, however. Without a clear positioning of the pictures in the space, the result would not be correct as the cameras could not be located correctly in dependency to each other. Targets on the ground, especially for field measurements, are highly recommended. The position of the targets can be measured with a GPS and the targets can be redetected later in the pictures.
Depending on the software used this process of “re-finding” can be done automatically or needs to be done manually.
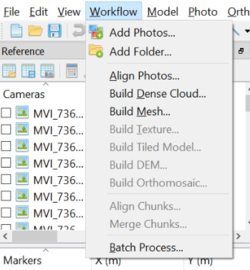
Again, there are different types of software available, commercial and non-commercial ones. As there is a very fast development and most non-commercial tools need a lot of experience with picture modifications etc. it is recommended, despite the costs, to use a commercial one such as Agisoft Photoscan for instance. In this software, the user can follow relatively easy the workflow provided by the program (Figure 3) to produce a DEM.
Application
As for other picture-based evaluation methods, the data processing is the most demanding part of the measurement. When starting with the measurements in the field, it is highly recommended to use targets. The rough workflow is as follows:
- Putting targets on the ground with sufficient visibility. The quality of the results increases in case there are two to three targets visible in every picture. Hence the distribution of the targets depend on the flight height of the camera.
- The camera is usually mounted on a drone, however other constructions as a crane etc. are possible.
- Speed and height over ground depend on the area to be evaluated.
- In case large areas need to be covered an automated flight route programmed for the drone would be useful.
- Starting and landing the drone can be a crucial point, especially in the case this is done automatically and the connection is nut sufficient.
- Further problems can be caused by wind (for the flying performance) and by reflections (for the resulting pictures).
Once the measurements are done the evaluation is the most crucial point. Depending on the number of pictures evaluated the result quality de- or increases and in a reverse way the computer performance and power needed in- or decreases (Figure 4).
Mitigation measures where MTD might be applied
Other information
The highest cost is the software license in case a commercial product is used.
Relevant literature
- Alfredsen, K., Haas, C., Tuthan, J., Zinke, P., 2018. Brief Communication: Mapping river ice using drones and structure from motion.
- Bouhoubeiny, E., Germain, G., Druault, P., 2011. Time-Resolved PIV investigations of the flow field around cod-end net structures. Fisheries Research 108, 344–355. https://doi.org/10.1016/j.fishres.2011.01.010
- Buscombe, D., 2016a. Spatially explicit spectral analysis of point clouds and geospatial data. Computers & Geosciences 86, 92–108. https://doi.org/10.1016/j.cageo.2015.10.004
- Buscombe, D., 2016b. Spatially explicit spectral analysis of point clouds and geospatial data. Computers & Geosciences 86, 92–108. https://doi.org/10.1016/j.cageo.2015.10.004
- Cunliffe, A.M., Brazier, R.E., Anderson, K., 2016. Ultra-fine grain landscape-scale quantification of dryland vegetation structure with drone-acquired structure-from-motion photogrammetry. Remote Sensing of Environment 183, 129–143. https://doi.org/10.1016/j.rse.2016.05.019
- Flammang, B.E., Lauder, G.V., Troolin, D.R., Strand, T.E., 2011. Volumetric imaging of fish locomotion. Biol. Lett. 7, 695–698. https://doi.org/10.1098/rsbl.2011.0282
- Govindu, V.M. (2001). "Combining two-view constraints for motion estimation". IEEE Computer Society Conference on Computer Vision and Pattern Recognition
- Koci, J., Jarihani, B., Leon, J.X., Sidle, R., Wilkinson, S., Bartley, R., 2017. Assessment of UAV and Ground-Based Structure from Motion with Multi-View Stereo Photogrammetry in a Gullied Savanna Catchment. ISPRS International Journal of Geo-Information 6, 328. https://doi.org/10.3390/ijgi6110328
- Kothnur, P.S., Tsurikov, M.S., Clemens, N.T., Donbar, J.M., Carter, C.D., 2002. Planar imaging of CH, OH, and velocity in turbulent non-premixed jet flames. Proceedings of the Combustion Institute 29, 1921–1927. https://doi.org/10.1016/S1540-7489(02)80233-4
- Langhammer, J., Lendzioch, T., Miřijovský, J., Hartvich, F., 2017. UAV-Based Optical Granulometry as Tool for Detecting Changes in Structure of Flood Depositions. Remote Sensing 9, 240. https://doi.org/10.3390/rs9030240
- LI, S., CHENG, W., WANG, M., CHEN, C., 2011. The flow patterns of bubble plume in an MBBR. Journal of Hydrodynamics, Ser. B 23, 510–515. https://doi.org/10.1016/S1001-6058(10)60143-6
- Lükő, G., Rüther, D.N., n.d. UAV BASED HYDROMORPHOLOGICAL MAPPING OF A RIVER REACH TO IMPROVE HYDRODYNAMIC NUMERICAL MODELS 1.
- Lükő, G., Rüther, D.N., n.d. UAV Based Hydromorphological Mapping of a River Reach to Improve Hydrodynamic Numerical Models.
- Morgan et al. - 2017 - Application of Structure-from-Motion photogrammetr.pdf, n.d.
- Morgan, J.A., Brogan, D.J., Nelson, P.A., 2017. Application of Structure-from-Motion photogrammetry in laboratory flumes. Geomorphology 276, 125–143. https://doi.org/10.1016/j.geomorph.2016.10.021
- Paterson, D.M., Black, K.S., 1999. Water Flow, Sediment Dynamics and Benthic Biology, in: D.B. Nedwell and D.G. Raffaelli (Ed.), Advances in Ecological Research. Academic Press, pp. 155–193.
- Schönberger, J.L & Frahm, J.M. (2016). "Structure-from-Motion Revisited" (PDF). IEEE Computer Society Conference on Computer Vision and Pattern Recognition.
- Tytell, E.D., 2011. BUOYANCY, LOCOMOTION, AND MOVEMENT IN FISHES | Experimental Hydrodynamics, in: Anthony P. Farrell (Ed.), Encyclopedia of Fish Physiology. Academic Press, San Diego, pp. 535–546.
- Vázquez-Tarrío, D., Borgniet, L., Liébault, F., Recking, A., 2017. Using UAS optical imagery and SfM photogrammetry to characterize the surface grain size of gravel bars in a braided river (Vénéon River, French Alps). Geomorphology 285, 94–105. https://doi.org/10.1016/j.geomorph.2017.01.039
- Westoby et al. - 2012 - ‘Structure-from-Motion’ photogrammetry A low-cost.pdf, n.d.
- Westoby, M.J., Brasington, J., Glasser, N.F., Hambrey, M.J., Reynolds, J.M., 2012. ‘Structure-from-Motion’ photogrammetry: A low-cost, effective tool for geoscience applications. Geomorphology 179, 300–314. https://doi.org/10.1016/j.geomorph.2012.08.021


