Difference between revisions of "COSH-tool"
Bendikhansen (talk | contribs) (Replaced content with "Developed by: SINTEF Energy Research Date: 27-11-2018 Type: Tool (computer model) Suitable for environmental flow (hydropeaking) mitigation measure in all phases (plannin...") |
m |
||
| (57 intermediate revisions by 3 users not shown) | |||
| Line 1: | Line 1: | ||
| + | {{Note|This technology has been enhanced in the FIThydro project! See [[Innovative technologies from FIThydro]] for a complete list.|reminder}} | ||
| + | =Quick summary= | ||
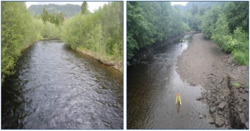
| + | [[file:cosh_tool_lundesoka.png|thumb|250px|Figure 1: The river Lundesokna in Norway downstream of a peaking hydropower plant. COSH-Tool can be used to asses many aspects of peaking operations (source:SINTEF Energy Research).]] | ||
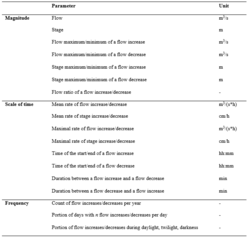
| + | [[file:cosh_tool_parameters.png|thumb|250px|Figure 2: List of parameters computed by COSH-Tool (click to expand) (source:SINTEF Energy Research).]] | ||
| + | [[file:cosh_tool_peaks_hour.png|thumb|250px|Figure 3: Distribution of peak events though the day (click to expand)(source:SINTEF Energy Research).]] | ||
| + | [[file:cosh_tool_peaks_day.png|thumb|250px|Figure 4: Number of peak events per day for each year of the time series (click to expand)(source:SINTEF Energy Research).]] | ||
| + | [[file:cosh_tool_light.png|thumb|250px|Figure 5: Distribution of peak events (increasing events) per month according to light conditions (click to expand)(source:SINTEF Energy Research).]] | ||
Developed by: SINTEF Energy Research | Developed by: SINTEF Energy Research | ||
| + | |||
Date: 27-11-2018 | Date: 27-11-2018 | ||
| + | |||
Type: Tool (computer model) | Type: Tool (computer model) | ||
| − | + | ||
| + | =Introduction= | ||
| + | COSH-Tool is a software written in [https://www.python.org Python] used for quantifying fluctuations in water level and discharge which may occur in rivers subjected to hydropeaking. COSH-Tool was developed at SINTEF Energy as a part of the [https://www.cedren.no/english/home CEDREN] EnviPeak project (Norwegian Research Council, Grant number 193818), with the aim of providing characteristics of hydropeaking events in regulated rivers, in order to classify the hydropeaking regimes of rivers. | ||
| + | The tool enables the analysis of long time series of water level or discharge by applying an automated processing to the time series. It provides a set of indicators that characterize fluctuations of water level and discharge in rivers and lakes/reservoirs. | ||
| + | |||
| + | =Application= | ||
| + | COSH-Tool can be applied to any water level or discharge time series provided by measurements (field work) or simulation (numerical modelling). The analysis of the time series with COSH-Tool does not require any coding from the user and is executed through an interface. | ||
| + | |||
| + | Input files: | ||
| + | The input file is a water level or discharge time series. COSH-Tool handles time series with any resolution, typically with time steps ranging from minutes to hours. | ||
| + | |||
| + | Output files: | ||
| + | COSH-Tool computes a set of parameters that characterise water level and discharge fluctuations. The parameters can be classified in three categories of fluctuations: 1) magnitude ; 2) timing and rapidity; and 3) frequency. The parameters are listed in Figure 2. | ||
| + | |||
| + | The output from COSH-Tool consists in a table with statistics of the magnitude and timing parameters (category 1 and 2) and a set of corresponding graphs. Statistics are min, max, mean, median, standard deviation and percentiles. They can be computed for the entire time series, as well as on a monthly, seasonal and annual basis. Statistics are also displayed in the form of box plots. | ||
| + | |||
| + | COSH-Tool also provides values and graphs for all frequency parameters (category 3), namely distribution of peaks throughout the day (Figure 3), number of peaks per day for each year of the time series (Figure 4), and total number of peak events per year. | ||
| + | |||
| + | Additionally, the light conditions (day, twilight, darkness) at the time of the occurrence of the peaks can be computed. A graph provides the proportion of peaks occurring at the different types of light conditions per month (Figure 5). | ||
| + | |||
| + | =Relevant mitigation measures and test cases= | ||
| + | {{Suitable measures for COSH-tool}} | ||
| + | |||
| + | =Other information= | ||
| + | The COSH-Tool is free to use after agreement with SINTEF Energy Research. | ||
| + | =Contact information= | ||
| + | Julie.charmasson@sintef.no | ||
| + | |||
| + | lennart.schonfelder@sintef.no | ||
| + | |||
| + | =Relevant literature= | ||
| + | *[https://www.researchgate.net/publication/260442647_A_computational_tool_for_the_characterisation_of_rapid_fluctuations_in_flow_and_stage_in_rivers_caused_by_hydropeaking Sauterleute J. and Charmasson J. 2014]. A computational tool for the characterisation of rapid fluctuations in flow and stage in rivers caused by hydropeaking. <i>Environmental Modelling & Software</i> <b>55</b>:266-278. | ||
| + | |||
| + | *[http://proceedings.ise2016.org/tracks/1105/abstract/26774.html Charmasson, J. 2016]. COSH-Tool, a computational tool for the characterization of rapid fluctuations in flow and stage in rivers caused by hydropeaking. <i>Proceedings of 11th International Symposium on Ecohydraulics, Melbourne, Australia.</i> | ||
| + | |||
| + | *Caetano, L., Pinheiro, A. and Boavida, I. 2018. Analysis of the effects of a hydropower plant in the downstream fish habitat. COSH-tool application. <i>Proceedings of 12th International Symposium on Ecohydraulics, Tokyo, Japan.</i> | ||
| + | |||
| + | [[Category:Tools]] [[Category:Enhanced in FIThydro]] | ||
Latest revision as of 13:03, 26 October 2020
Contents
Quick summary
Developed by: SINTEF Energy Research
Date: 27-11-2018
Type: Tool (computer model)
Introduction
COSH-Tool is a software written in Python used for quantifying fluctuations in water level and discharge which may occur in rivers subjected to hydropeaking. COSH-Tool was developed at SINTEF Energy as a part of the CEDREN EnviPeak project (Norwegian Research Council, Grant number 193818), with the aim of providing characteristics of hydropeaking events in regulated rivers, in order to classify the hydropeaking regimes of rivers. The tool enables the analysis of long time series of water level or discharge by applying an automated processing to the time series. It provides a set of indicators that characterize fluctuations of water level and discharge in rivers and lakes/reservoirs.
Application
COSH-Tool can be applied to any water level or discharge time series provided by measurements (field work) or simulation (numerical modelling). The analysis of the time series with COSH-Tool does not require any coding from the user and is executed through an interface.
Input files: The input file is a water level or discharge time series. COSH-Tool handles time series with any resolution, typically with time steps ranging from minutes to hours.
Output files: COSH-Tool computes a set of parameters that characterise water level and discharge fluctuations. The parameters can be classified in three categories of fluctuations: 1) magnitude ; 2) timing and rapidity; and 3) frequency. The parameters are listed in Figure 2.
The output from COSH-Tool consists in a table with statistics of the magnitude and timing parameters (category 1 and 2) and a set of corresponding graphs. Statistics are min, max, mean, median, standard deviation and percentiles. They can be computed for the entire time series, as well as on a monthly, seasonal and annual basis. Statistics are also displayed in the form of box plots.
COSH-Tool also provides values and graphs for all frequency parameters (category 3), namely distribution of peaks throughout the day (Figure 3), number of peaks per day for each year of the time series (Figure 4), and total number of peak events per year.
Additionally, the light conditions (day, twilight, darkness) at the time of the occurrence of the peaks can be computed. A graph provides the proportion of peaks occurring at the different types of light conditions per month (Figure 5).
Relevant mitigation measures and test cases
| Relevant measures | |
|---|---|
| Fish refuge under hydropeaking conditions | |
| Mitigating rapid, short-term variations in flow (hydro-peaking operations) | |
| Mitigating reduced annual flow and low flow measures | |
| Mitigating reduced flood peaks, magnitudes, and frequency | |
| Relevant test cases | Applied in test case? |
| Anundsjö test case | - |
| Bragado test case | Yes |
Other information
The COSH-Tool is free to use after agreement with SINTEF Energy Research.
Contact information
Julie.charmasson@sintef.no
lennart.schonfelder@sintef.no
Relevant literature
- Sauterleute J. and Charmasson J. 2014. A computational tool for the characterisation of rapid fluctuations in flow and stage in rivers caused by hydropeaking. Environmental Modelling & Software 55:266-278.
- Charmasson, J. 2016. COSH-Tool, a computational tool for the characterization of rapid fluctuations in flow and stage in rivers caused by hydropeaking. Proceedings of 11th International Symposium on Ecohydraulics, Melbourne, Australia.
- Caetano, L., Pinheiro, A. and Boavida, I. 2018. Analysis of the effects of a hydropower plant in the downstream fish habitat. COSH-tool application. Proceedings of 12th International Symposium on Ecohydraulics, Tokyo, Japan.


