Difference between revisions of "3D fish tracking system"
Bendikhansen (talk | contribs) |
Bendikhansen (talk | contribs) |
||
| Line 1: | Line 1: | ||
=Quick summary= | =Quick summary= | ||
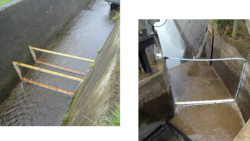
| − | [[file:3d_fish_tracking_installation1|thumb|250px|Figure 1: 3D fish tracking system (empty) installed in the etho-hydraulic flume at VAW of ETH Zurich (source: VAW)]] | + | [[file:3d_fish_tracking_installation1.jpg|thumb|250px|Figure 1: 3D fish tracking system (empty) installed in the etho-hydraulic flume at VAW of ETH Zurich (source: VAW)]] |
| − | [[file:3d_fish_tracking_installation2|thumb|250px|Figure 2: 3D fish tracking system (filled) installed in the etho-hydraulic flume at VAW of ETH Zurich (source: VAW)]] | + | [[file:3d_fish_tracking_installation2.jpg|thumb|250px|Figure 2: 3D fish tracking system (filled) installed in the etho-hydraulic flume at VAW of ETH Zurich (source: VAW)]] |
[[file:tuning_capacitor.jpg|thumb|250px|Figure 3: Example of a tuning capacitor (source: AFB).]] | [[file:tuning_capacitor.jpg|thumb|250px|Figure 3: Example of a tuning capacitor (source: AFB).]] | ||
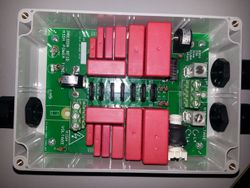
[[file:RFID_reader.jpg|thumb|250px|Figure 4: Example of a RFID reader (source: AFB).]] | [[file:RFID_reader.jpg|thumb|250px|Figure 4: Example of a RFID reader (source: AFB).]] | ||
Revision as of 09:36, 17 June 2019
Quick summary
Date: 1973
Developed by:
Suitable for the following [[::Category:Measures|measures]]:
Introduction
Laboratory investigations with live-fish, i.e. so-called etho-hydraulic tests, serve to understand interactions between the hydraulics of fish protection technologies and fish behaviour and hence to improve the current design of fish passages or develop new technologies. For laboratory application, VAW of ETH Zurich developed a three dimensional (3D) fish tracking system consisting of synchronous vertically submerged cameras and a MATLAB-based 3D tracking software to determine fish locations in the flow from the recorded videos (Figure 12).
Typically, the behaviour of aquatic fauna is documented by manual protocol written down by biologists and (optional) supplementary video recording. The main drawbacks of both techniques are (i) time consuming, (ii) low time resolution, (iii) low spatial resolution, and (iv) providing only qualitative information. The present 3D fish tracking system overcomes such drawbacks by automatically and accurately providing 3D swimming tracks on a larger metric space at a milliseconds time resolution.
The software tracks several fish in 3D. Swimming path-time diagrams give a distinct ‘big picture’ of the fish movement, which helps to identify fish preferred and disliked regions. Furthermore, detailed 3D path analyses of fish interactions and fish velocities are provided as well. The details of the system are documented below. Although the 3D fish tracking system is developed for laboratory use, it may be applied in an adapted version in the field to monitor fish movements or counting, as long as the visual observation is not compromised by turbidity.


